
A framework that can help you to show the value of research in practice
Measuring the impact of UX Research (UXR) is both a major challenge and opportunity for Product and Design teams. Understanding the value generated by research—beyond operationalizing and executing the process—is essential to ensure that the team’s work is recognized and, most importantly, drives real changes for both the business and users. And yet, so much of it remains a "black box."
So how do we translate this impact into language the whole organization understands? Let’s break down some common challenges, rethink what “impact” really means in UXR, and explore ways to track it more effectively.
Important: This article doesn’t offer definitive answers. My proposal here is to start a conversation, spark reflection, and help you think about what can be observed within your company when seeking evidence for the value of researching.
After deep reflection on my own experiences and considering my contact with UXR and ResearchOps professionals, I want to start this conversation with you by addressing the three main barriers I see when teams try to measure research impact.
Research doesn’t always create an immediate bump in KPIs like revenue or retention. (If you're a business leader, that may have been a bucket of cold water.) Sometimes its biggest contribution is preventing a bad decision, for example, like stopping a feature that would have cost months of development only to end up collecting “dust”. That’s a huge win—it just doesn’t show up on a performance dashboard.
For many teams, research feels invisible. Stakeholders see reports and insights, but they don’t always see the connection between those findings and the company’s outcomes. When that link isn’t clear, research can be dismissed as nice-to-have instead of essential (that may be dangerous for us).
It’s tempting to measure output: number of interviews, surveys, or studies completed. Those numbers look good on a slide, but they don’t reveal whether anything actually changed because of the work. Ten interviews mean very little if the insights didn’t influence a single decision.
Measuring impact is simply about asking: What changed because of research?For example, consider the following questions in the context of your own experiences as a researcher:
Answering “yes” to any of these questions indicates some level of research impact. That’s why I encourage you to move beyond activity-based metrics (how much we did) to impact-focused metrics (what difference it made).
What should we measure? This is an important question to ask and one that often doesn’t get a clear answer at first, causing teams to lose time or get confused in the process. There are three environments that can (and should) be constantly analyzed when the goal is to know if UXR is working in harmony: operations, projects, and discipline.
While each of these is connected, understanding that they sit in different boxes is key (all within the larger box of “Research”, of course).
This box is the ResearchOps environment, where the organization and support for research work happen. It includes processes, tools, repositories, training, participant recruitment, and standardization of practices. This is where ResearchOps pros work “behind the scenes,” ensuring that researchers, designers, and PMs have the conditions to conduct research efficiently and at scale.
Example: Standardizing templates saved hours per project and improved consistency across studies.
This is the box of research projects themselves, with a beginning, middle, and end, focused on solving specific problems, generating insights, or testing hypotheses. A project can result in increased conversion, new ideas for experiments, stronger connections between users and stakeholders, or resource savings. The impact of a project can be tracked with specific metrics such as revenue growth, user satisfaction, or reduced churn.
Example: A usability test reduced checkout abandonment by simplifying the payment flow.
The third box is the discipline of research within the organization as a whole, including team structure, processes, culture, governance, and integration with other areas. In large companies, this may involve creating centers of excellence, communities of practice, and governance systems to ensure quality and alignment of research. In some contexts, the discipline box may overlap with the operations box.
Example: Research showed that a new market segment had very different needs, prompting leadership to reprioritize the roadmap.
With these three boxes in mind, let's go a step further. There are so many interpretations and applications of the verb “to measure” that it’s worth shining a light on what boxes we’ll open and connect to what we need. That’s why talking about metrics may not always mean the same as talking about impact in certain contexts—and that’s without even bringing ROI into the conversation.
The metrics box contains indicators used to track the progress of initiatives and their results. Some examples include:
…and others.
The outcomes box comes with a bigger question: What changes were actually caused by research—whether in the product, the business, or the user experience? Impact can be measured through less quantifiable and more conceptual outcomes, such as:
In other words: what didn’t exist (or wasn’t possible) before research that now exists (or became possible) afterward?
If you’d like help getting started, I created a spreadsheet and form template, based on another piece of content that really opened my mind (referenced in the template) which you can download below.
This box is about the relationship between the investment made in research and the financial or strategic return generated from it. ROI can be difficult to calculate directly since not all research impact is immediately measurable in monetary terms. However, it can be estimated based on observed metrics and impacts.
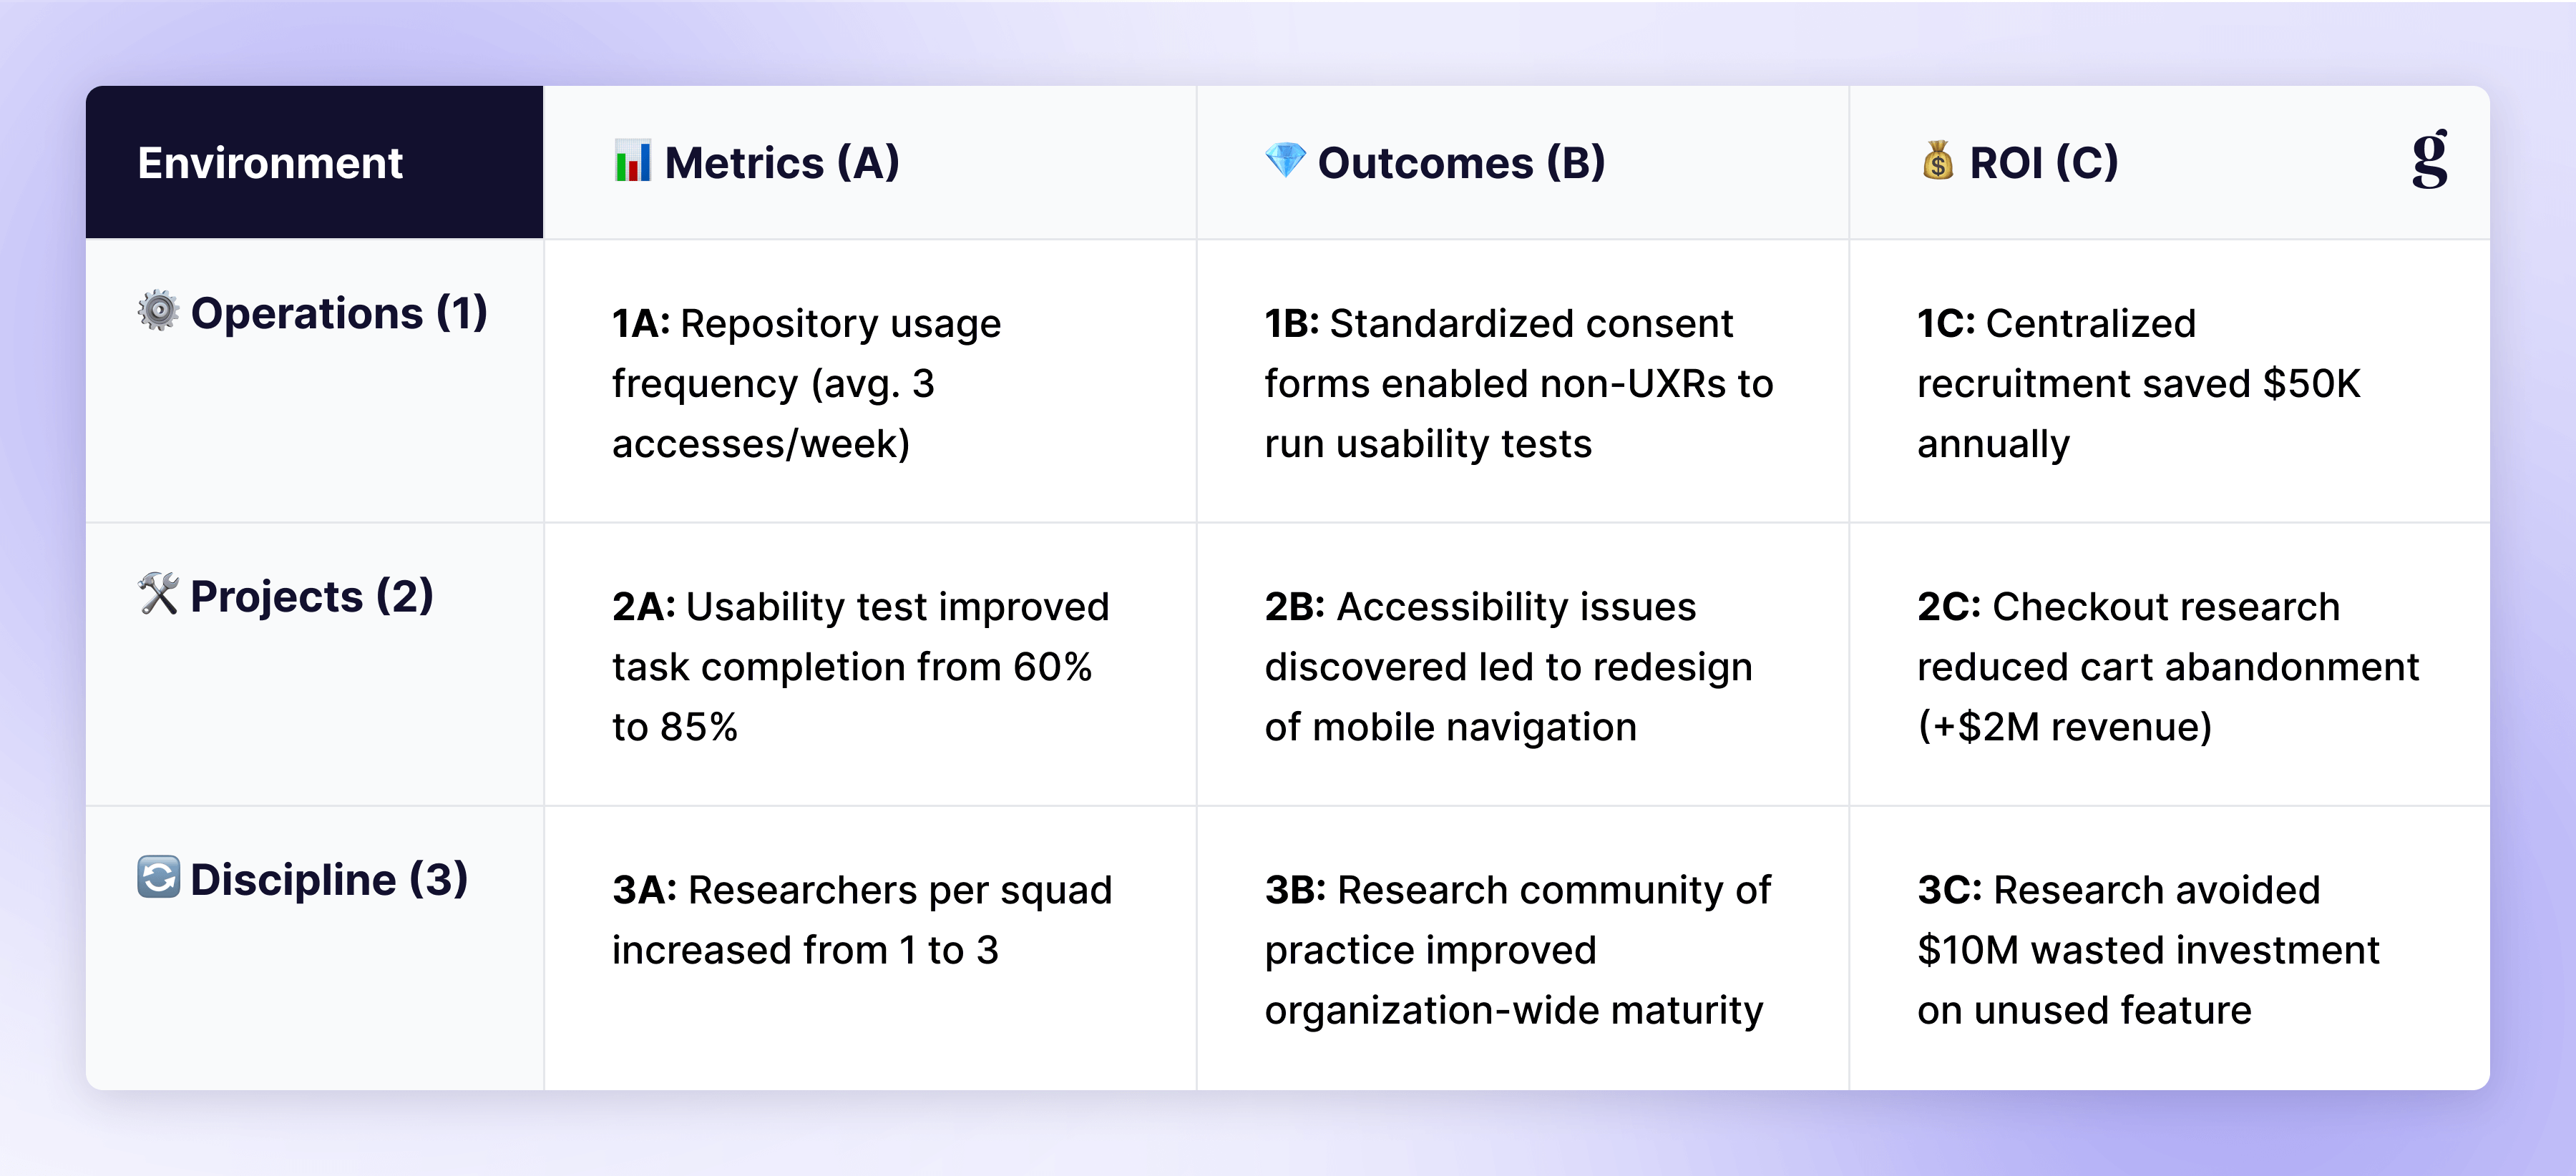
With three boxes to help us understand what to measure (Operations, Projects, and Discipline) and three more to help us understand possible paths (Metrics, Outcomes, and ROI), the magic happens when you combine them.
In your team, it may make sense to measure project metrics and also the impact of research projects. In another company, it may be research operations metrics that matter most. There’s no right or wrong combination here—though some are more common—but you decide what you need in order to highlight your team’s achievements. Here are some examples of Impact Boxes combinations:
I hope you find this framework helpful. When using it to measure research impact in your org, here are a few practical methods for tracking to consider:
Even though all roads lead to Rome—we as UXRs want more recognition and greater investment in our teams—we need to understand the different ways we can walk those roads.
Sometimes your focus will be operational (how efficiently the team works). Other times it will be project-level (what changed in the product). And often, the biggest wins are strategic (influencing the direction of the company).
The real shift comes when we stop proving that research is “busy” and start showing how it shapes outcomes that matter.
That’s how we start moving UXR from a misunderstood “black box” to a recognized driver of product and business success.


Pedro Vargas is a Brazilian researcher, mentor and teacher. A content creator for thousands of professionals, he has a postgraduate degree in Business Management and Marketing and is UX Certified by the Nielsen Norman Group, with an emphasis on UX Management. He teaches and learns about ResearchOps and UX Research in his classes and has worked in youth entrepreneurship initiatives all over the world.
.png)

.png)

.png)